
There is no such thing as information overload. There is only bad design — Edward Tufte, Statistician, Visualizer, artist, professor.
Data has traveled the journey from being limited and expensive to be abundant and cheap. The astonishing amount of information we produce today is so huge that the human brain cannot process it all at once. The practice of translating all the information into a visual context with patterns, geometry, and colors makes everything easy to understand. In simple terms, Data Visualization is a visual explanation of information showing relationships of different objects within the information set.
Human brain processes complex information using charts, graphics, patterns & colours easily over spreadsheets or documented reports. Data visualization is the easiest way to convey concepts and experiments with different scenarios by making slight adjustments. With this, our eyes can see the connections that matter and focus on important information.
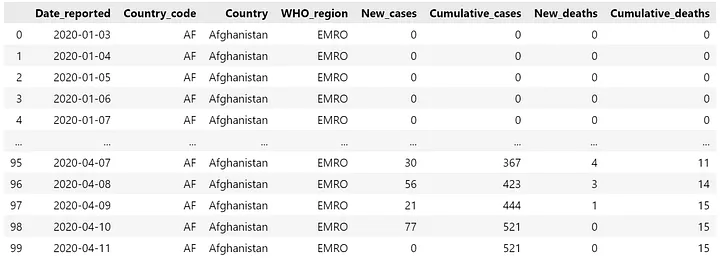
EG: Sample Covid-19 dataset
What raw data looks like ?
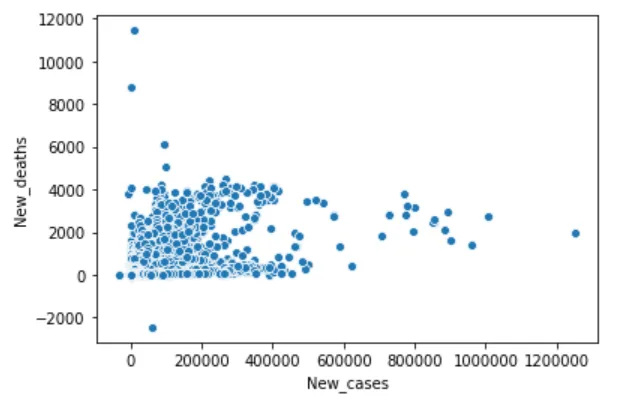
If you have to identify the relationship between ‘New_cases’ vs ‘New_deaths’, it will be difficult to do it. Similar can be achieved with a simple scatter plot.
Four pillars of Data Visualization
- Purpose: Why are you creating this? Who is your audience? What they will understand and what kind of actions take can take? How it will be consumed? What could be the key take away message?
- Content: What data and relationship should be included? What to be excluded? Focus on only what’s necessary.
- Structure: Graphs such as lines, bars, scatters, etc. Structure should support your purpose and reveal your conent.
- Formatting: Other elements such as position, placement, text, labels, titles, colors, shape, icons, saturation, patterns, weight, etc. Formatting should be used to focus and not to distract.
Principals of Visualization
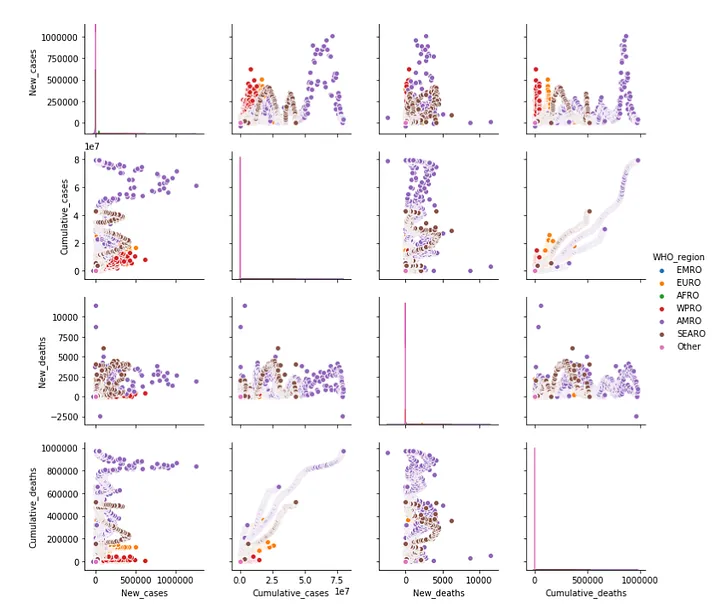
Show all data — Multivariate data and metadata.
Small Multiples are small, thumbnail-sized representations of multiple images displayed all at once, which allows the reader to immediately, and in parallel, compare the inter-frame differences.
Example from covid-19 dataset released by WHO, One vs all, what that does to your perception ?
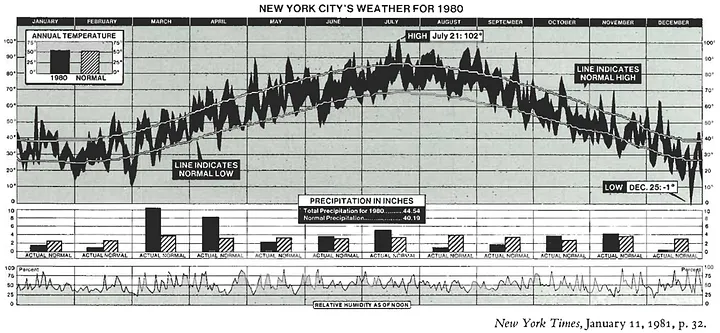
Revelaing the data at several levels
It bring out greater visual context which helps your audience to comprehend different dimensions and layers of the chart.
Example showing the data across the spectrum of details:
It bring out greater visual context which helps your audience to comprehend different dimensions and layers of the chart.
Example showing the data across the spectrum of details:
Like a telescope or microscope that increases your perceptual abilities, information visualization amplifies your cognitive abilities to understand complex processes so as to support better decisions — Ben Shneiderman.
Induce the viewer to think about the substance rather then graphic design — Maximize the data to ink ratio.
The interior decoration of graphics generates a lot of ink that does not tell the viewer anything new. The usual exercise of artistic skills in one single chart is often overloaded. Elements such as chart backgrounds, bolded titles, and confusing gridlines on both the axis or the 3D shape, it’s all on-data-ink or redundant data-ink known as chartjunk.
Using grayscale sparingly helps to lighten the stress on the eyes of observer. It can also help to reduce the black ink consumption significantly.
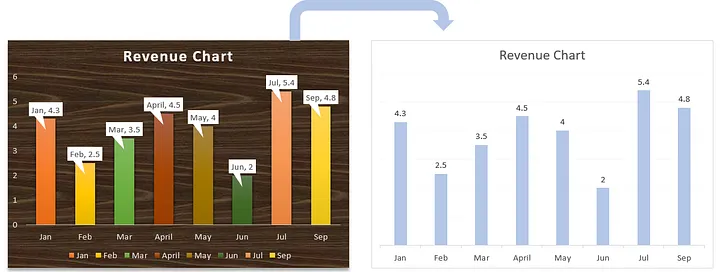
LESS is more ATTRACTIVE | IMPRESSIVE |EFFECTIVE | IMPACTIVE
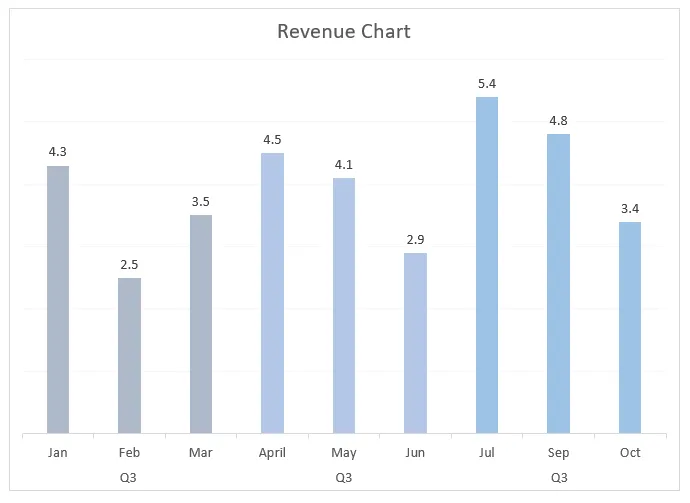
Encourage the eye to compare different pieces of data
Keep an eye on the similarities where you can guide your audience to compare data within different dimensions. Here in the example below, you can compare the sales performance by month as well as by quarter.
Highlight the data that matters
It is necessary to cut the object and color clutter and highlight to the only piece which matters and you’d wish to communicate with audience. Brain should focus on the highlighted important things which needs attention that can support business critical decision making. You don’t just want to keep your audiences interested in the visual but to actually guide their eyes so that they are looking where you want them to.

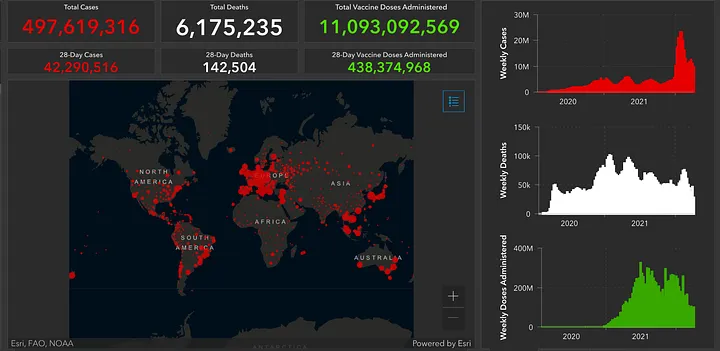
Be closely integrated with statistical and verbal descriptions of dataset
A good data visual should also be closely related to the properties verbal descriptions of the dataset. If you are showing any data related to the statistical different among geographies you can show a map to visualize it.
The human brain can process entire images that the eyes sees for as little as 13 milliseconds “In the blink of an eye”, MIT News, 2014.
In short, Humans are visual beings and data is getting complex every day. Good visualizations to such complex datasets can help us acheive effective outputs in less time.
John Tukey, Mathematician & Statistician , said “The greatest value of a picture is when it forces us to see what we never expected to see” It might be cliche in the world of data visualization but it is an absolute truth.
The Importance of Storytelling in Data Visualization
Data alone can be overwhelming and fail to engage your audience. By incorporating storytelling techniques, you can transform raw data into a narrative that resonates with your viewers. Storytelling creates a connection, sparks interest, and makes information more relatable and memorable. It enables you to convey complex concepts and insights in a way that is easily understood and appreciated.
Crafting Your Data Story
To create an effective data story, start by understanding your audience and their context. What are their interests, needs, and pain points? Next, identify the key insights from your dataset and determine the central message you want to convey. This will serve as the foundation for your narrative. Use visual elements, such as charts, graphs, and infographics, to support your story and make it visually appealing and easy to comprehend.
Building Engagement and Excitement
A compelling data story not only captures attention but also generates excitement. Consider using techniques like suspense, surprise, or a personal touch to create emotional connections with your audience. Present your data in a logical sequence, gradually revealing insights and building anticipation. Keep the narrative concise and focused, ensuring that each element contributes to the overall story arc.
Ensuring Accuracy and Transparency
While storytelling can enhance communication, it’s essential to maintain the integrity of your data. Ensure that your visuals accurately represent the underlying information, and clearly label and explain any assumptions or limitations. Transparency builds trust with your audience and reinforces the credibility of your narrative.
Data visualization goes beyond presenting facts and figures; it involves crafting a compelling story that resonates with your audience. By incorporating storytelling techniques into your data visualization process, you can captivate your viewers, convey complex insights effectively, and leave a lasting impact. So, embrace the power of storytelling in data visualization, and unlock the true potential of your data to communicate with clarity and excitement.